BCC
py实现eBPF程序
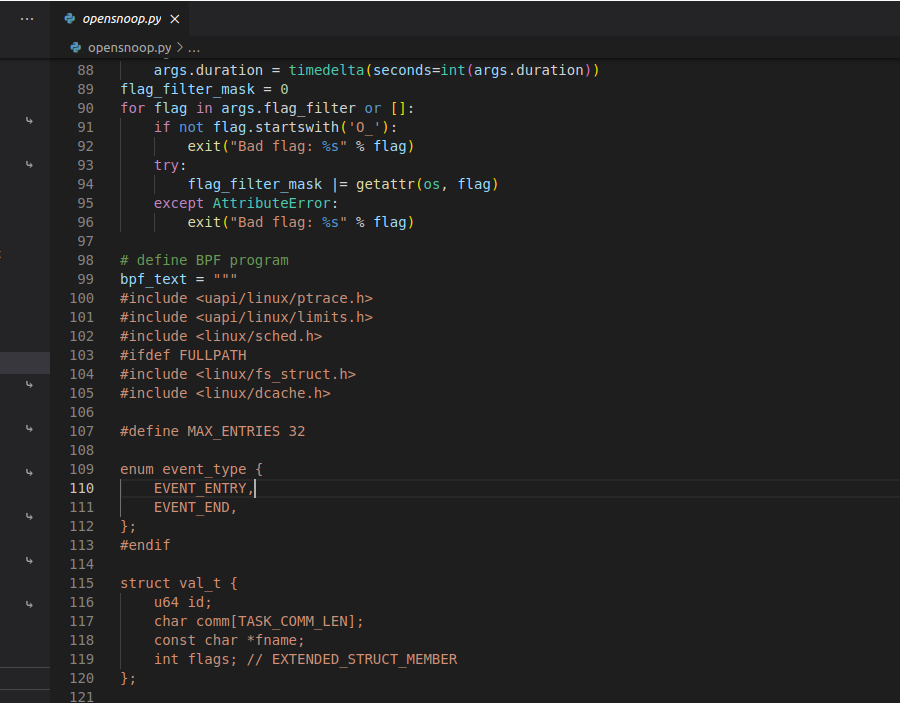
这里使用BCC的tools目录下的opensnoop.py程序,作为样例程序来解读一下。其中是python代码混合着C语言的代码一起编写的。
通过--ebpf参数可以将该python程序的eBPF的代码给完全的打印出来
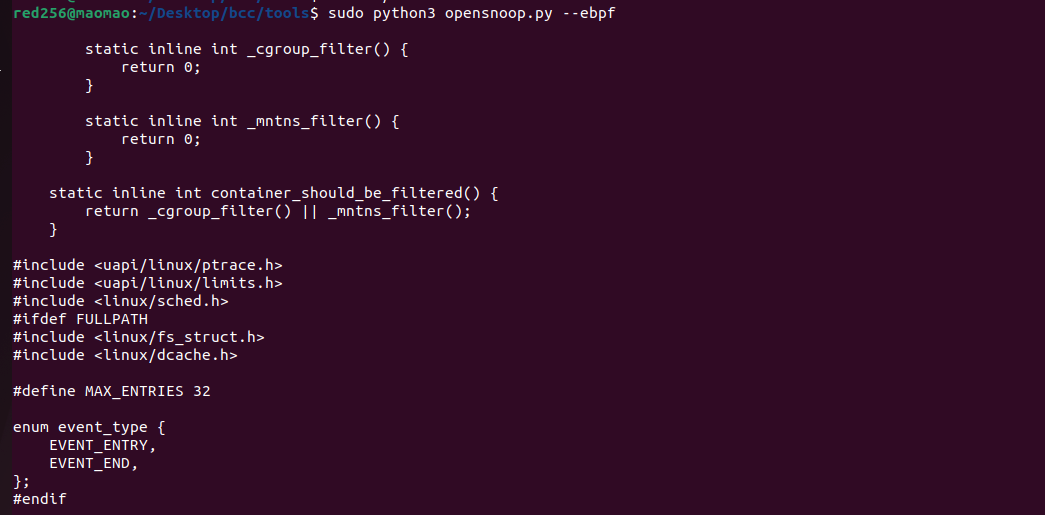
首先可以看到是执行了以下的代码,就是声明了一个b对象进行高级内核追踪和性能分析的对象。
1
2
| from bcc import BPF
b = BPF(text='')
|
b对象可以搜索可以使用的kprobe探测点以及tracepoints,还可以获取到系统调用的函数名,在eBPF程序中需要挂载对应的函数名才可以成功的挂载上。
1
2
3
4
5
6
7
8
| >>> b.get_kprobe_functions(b'open')
{b'open_substream', b'open_vmcore', b'open_cmd_db_debugfs', b'open_wait', b'open_collection', b'open_softirq', b'open_related_ns', b'open_kcore', b'open_last_lookups', b'open_exec', b'open_for_data', b'open_port', b'open_proxy_open'}
>>> b.get_tracepoints(b'syscalls:sys_enter_open')
['syscalls:sys_enter_openat2', 'syscalls:sys_enter_openat', 'syscalls:sys_enter_open_tree', 'syscalls:sys_enter_open_by_handle_at']
>>> b.get_syscall_fnname(b'clone')
b'__arm64_sys_clone'
|
在样例程序中存在关键的代码
1
2
3
4
5
6
7
8
9
10
11
12
13
14
| b = BPF(text=bpf_text)
if not is_support_kfunc:
b.attach_kprobe(event=fnname_open, fn_name="syscall__trace_entry_open")
b.attach_kretprobe(event=fnname_open, fn_name="trace_return")
b.attach_kprobe(event=fnname_openat, fn_name="syscall__trace_entry_openat")
b.attach_kretprobe(event=fnname_openat, fn_name="trace_return")
if fnname_openat2:
b.attach_kprobe(event=fnname_openat2, fn_name="syscall__trace_entry_openat2")
b.attach_kretprobe(event=fnname_openat2, fn_name="trace_return")
initial_ts = 0
|
在我们打印出的内核态的C的代码中存在着对syscall__trace_entry_open函数的定义
1
2
3
4
5
6
7
8
9
10
11
12
13
14
15
16
17
18
| int syscall__trace_entry_open(struct pt_regs *ctx, const char __user *filename, int flags)
{
struct val_t val = {};
u64 id = bpf_get_current_pid_tgid();
u32 pid = id >> 32;
u32 tid = id;
u32 uid = bpf_get_current_uid_gid();
if (container_should_be_filtered()) {
return 0;
}
if (bpf_get_current_comm(&val.comm, sizeof(val.comm)) == 0) {
val.id = id;
val.fname = filename;
infotmp.update(&id, &val);
}
return 0;
};
|
需要关注的是python是怎么实现内核态程序和python用户态程序之间的数据通信的。在内核态的代码中可以看到trace_return是当返回值的时候进行触发的函数。其中关键存在 events.perf_submit这个函数,将数据传递到用户空间。
1
2
3
4
5
6
7
8
9
10
11
12
13
14
15
16
17
18
19
20
21
22
| int trace_return(struct pt_regs *ctx)
{
u64 id = bpf_get_current_pid_tgid();
struct val_t *valp;
struct data_t data = {};
u64 tsp = bpf_ktime_get_ns();
valp = infotmp.lookup(&id);
if (valp == 0) {
return 0;
}
bpf_probe_read_kernel(&data.comm, sizeof(data.comm), valp->comm);
bpf_probe_read_user_str(&data.name, sizeof(data.name), (void *)valp->fname);
data.id = valp->id;
data.ts = tsp / 1000;
data.uid = bpf_get_current_uid_gid();
data.ret = PT_REGS_RC(ctx);
events.perf_submit(ctx, &data, sizeof(data));
infotmp.delete(&id);
return 0;
}
|
之后在python的代码中,b["events"].open_perf_buffer是在监听eBPF程序中通过events这个perf输出缓冲区传递到用户空间的事件。内核态的代码中存在一段代码BPF_PERF_OUTPUT(events);就是这段代码指定了events输出缓冲区的。
1
2
3
4
5
6
7
8
| def print_event(cpu, data, size):
event = b["events"].event(data)
global initial_ts
if not args.full_path or event.type == EventType.EVENT_END:
skip = False
b["events"].open_perf_buffer(print_event, page_cnt=args.buffer_pages)
|
最后我有一个测试的新写的代码,提供学习
1
2
3
4
5
6
7
8
9
10
11
12
13
14
15
16
17
18
19
20
21
22
23
24
25
26
27
28
29
30
31
32
33
34
35
36
37
38
39
40
41
42
43
44
45
46
47
48
49
50
51
52
53
54
55
56
57
58
59
60
| from bcc import BPF
import ctypes as ct
bpf_text = """
#include <uapi/linux/ptrace.h>
#include <linux/sched.h>
struct data_t {
u32 pid;
u64 ts;
char comm[TASK_COMM_LEN];
};
BPF_PERF_OUTPUT(test_events);
int trace_entry(struct pt_regs *ctx) {
struct data_t data = {};
data.pid = bpf_get_current_pid_tgid() >> 32;
data.ts = bpf_ktime_get_ns();
bpf_get_current_comm(&data.comm, sizeof(data.comm));
test_events.perf_submit(ctx, &data, sizeof(data));
return 0;
}
"""
b = BPF(text=bpf_text)
fnname_openat = b.get_syscall_prefix().decode() + 'openat'
b.attach_kprobe(event=fnname_openat,fn_name="trace_entry")
class Data(ct.Structure):
_fields_ = [
("pid", ct.c_uint),
("ts", ct.c_ulonglong),
("comm", ct.c_char * 16)
]
print("%-6s %-16s %s" % ("PID", "COMM", "TIME(ns)"))
def print_event(cpu, data, size):
event = ct.cast(data, ct.POINTER(Data)).contents
print("%-6d %-16s %s" % (event.pid, event.comm.decode('utf-8', 'replace'), event.ts))
def print_test(cpu, data, size):
event = ct.cast(data,ct.POINTER(Data)).contents
print("This is a test function for callback print")
b["test_events"].open_perf_buffer(print_test)
while 1:
try:
b.perf_buffer_poll()
except KeyboardInterrupt:
exit()
|